
Howdy Readers 🥰
In this newsletter, you’ll find:
⏱️ Your refresh schedule was built for a slower quarter
🔎 Product pages are winning more AI citations than Reddit or YouTube
👨💻 Quick hits
If you’re new to Buyology then a hearty welcome to you, You’ve reached the right place alongside 50k+ amazing people, Before you forget, if someone forwarded this newsletter to you, don't forget to subscribe to our newsletter so you never miss out!
Together with Insense
Your November Creator Roster Is Already Being Booked

BFCM is an expensive time to discover a creator cannot sell your product. Late briefs and unusable assets leave your team scrambling as ad spend peaks.
Insense gives brands scaling beyond $2M a faster way to pressure-test their creator bench before peak season.
Put products in creators’ hands early, so BFCM briefs come with product knowledge and content you already trust.
Turn a $1,000 budget into up to 20 UGC ads from five creators, creating more hooks to test from every shoot.
Connect Ads Manager to Insense’s performance dashboard to see which Partnership Ads and creators drive results, then rehire the strongest performers.
Insense provides access to 115,000+ creators across 57+ countries and is trusted by over 3500 brands like Il Makiage, Quince, Huda Beauty, and Monster Energy.
⏱️ Your refresh schedule was built for a slower quarter
Most teams run creative refresh on something close to a flat cadence year-round: swap in new ads every few weeks, watch performance, repeat. That cadence was tuned for a normal month.
Q4 compresses the same fatigue curve into a fraction of the time, since holiday competition means more advertisers bidding into the same audience, and creative that coasted for three weeks in June burns out in five days during peak week.
The teams still running their June refresh schedule in November aren’t being lazy. They’re applying a correct process to the wrong clock.
Watch hook and hold rate, not CPA, for the early warning
Creative fatigue shows up in hook rate and hold rate five to seven days before it shows up in cost per acquisition, which means a team waiting for CPA to move is always reacting a week late.
Build a standing check on hook rate specifically, since a Meta hook rate under 15% at meaningful impression volume signals structural failure worth killing outright, not iterating on. Catching that shift a week early is the difference between refreshing a creative on your terms and discovering it’s dead after a week of wasted spend.
Set separate refresh windows for top and bottom of funnel
Applying one refresh cadence across the whole funnel treats two different fatigue curves as if they were one.
Top-of-funnel prospecting creative, facing the broadest and most competitive audience, fatigues fastest and needs refreshing roughly every five to seven days during peak Q4 weeks.
Bottom-of-funnel retargeting creative, running against a narrower and less contested audience, can typically hold ten to fourteen days before performance meaningfully degrades. Running both on the same calendar means one is either refreshed too late or replaced before it needed to be.
Build variety into the replacement, not just volume
Five new ads that are the same hook with a different background color fatigue at close to the same rate as running one ad, since the algorithm is still testing the same underlying creative idea against the same audience.
Real variation means different hooks, different formats, and different angles on the same offer, run as three to five live variations per ad set heading into BFCM, weighted toward prospecting where the fatigue curve is steepest.
Knowing where your own numbers actually land against a category-specific benchmark, rather than a flat cross-industry number that doesn’t account for how differently each vertical peaks in Q4, is exactly what Billo built its free calculator to answer, drawn from 80,069 sales-objective Meta video ads across 14 categories from Q4 2025. You can check your Q4 benchmarks and see your category’s peak month, benchmark, and fix in under a minute.
A refresh schedule tuned for June doesn’t survive November. Neither does the budget spent running it that way.
🔎 Product pages are winning more AI citations than Reddit or YouTube
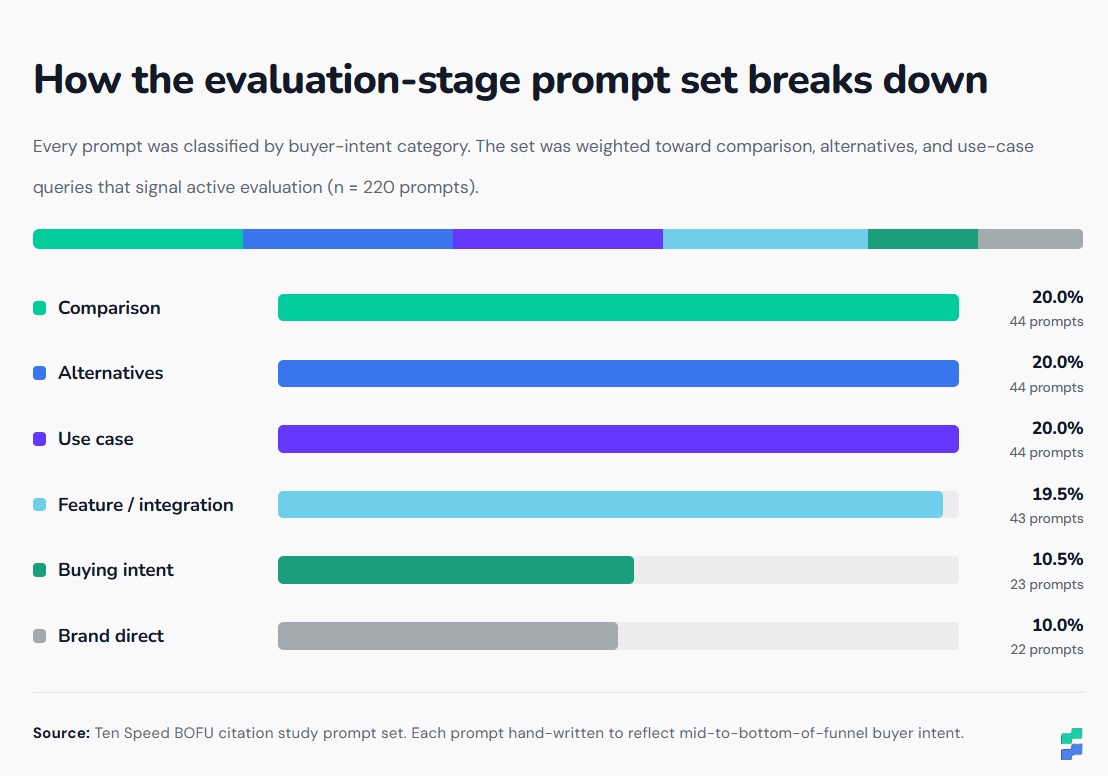
New Ten Speed research analyzed 7,387 citations from 170 B2B evaluation-stage prompts across ChatGPT, Perplexity, Claude and Gemini, examining what AI cites when buyers compare specific vendors and products.
The Breakdown:
Product pages lead AI citations: Product pages captured 24.1% of citations, followed by articles at 17.4%, while brand-controlled content collectively accounted for 88.3% of evaluation-stage citations.
Comparison content punches above its weight: Comparison prompts represented 20% of the dataset but generated nearly 27% of citations, giving comparison pages and related content a 1.33x citation return.
Reddit and YouTube play a smaller role: Reddit, YouTube, forums and discussion threads combined for just 4.2% of citations, with Reddit contributing most and YouTube accounting for roughly 1%.
The findings have important limitations: Results combine four AI platforms without platform-level breakdowns, cover Ten Speed’s B2B client base only, and the headline 24% versus 4% difference was descriptive rather than statistically tested.
The data suggests owned product and comparison pages may matter more once AI users move from researching a category to evaluating specific vendors. But the study is a directional snapshot, not evidence that Reddit or YouTube matter less across every stage or AI platform.
🗝️ Tweet of the Day

Advertise with Us
Wanna put out your message in front of over 50,000 best marketers and decision makers?
Checkout our Partner Kit here🤝
At Buyology, we care about our readers and want to provide the best possible experience. That's why we always look for ways to improve our content and connect with our audience. It would be amazing if you could hit us up with feedback about our content or absolutely anything, we are always up for a chat 🥰
Thanks for your support, We'll be back with more such content 🥳