
Howdy Readers 🥰
In this newsletter, you’ll find:
🔪The TACOS killing your Margins
🔍 AI Overviews are changing how people use Google
👨💻 Tweet of the Day
If you’re new to Buyology then a hearty welcome to you, You’ve reached the right place alongside 50k+ amazing people, Before you forget, if someone forwarded this newsletter to you, don't forget to subscribe to our newsletter so you never miss out!
🔪The TACOS killing your Margins
There’s a move most Amazon sellers make at least once, usually when ACoS climbs past an uncomfortable threshold. They log in, see a 38% ACoS on a Sponsored Products campaign, decide it’s wasteful, and cut bids. ACoS drops.
They feel like they’ve solved something. Then, 45 to 60 days later, organic revenue is down 30%, their BSR has slipped two pages, and their total revenue is lower than before they “fixed” the problem.
This is the TACoS trap. And it destroys more Amazon businesses than the competition ever will.
ACoS measures one thing: the efficiency of your paid traffic on a last-click basis. It completely ignores the organic halo your ads generate when they drive purchase velocity and push your listing up the keyword rankings.
TACoS (total advertising cost of sale) divides your total ad spend by your total revenue, both paid and organic. It’s the only metric that tells you whether your advertising is actually building something or just renting attention.
Here’s what the data actually says. A healthy launch phase TACoS of 30% to 50% is completely normal for a new ASIN in months one through three. That spend is buying sales velocity, which improves BSR, which improves keyword rank, which starts generating organic sales.
When that flywheel is running, TACoS naturally compresses over 6 to 12 months as organic revenue grows while ad spend stays flat. A TACoS trending from 40% down to 14% over 8 months means your ads did exactly what they were supposed to do.
A seller who cuts aggressively at 40% ACoS in month two never builds the velocity. Their TACoS stays high not because the ads are inefficient but because the organic side never accelerates. They’ve been optimizing the wrong number.
The tactical implication: track TACoS at the ASIN level, not just the account level. An ASIN with a 32% TACoS after 18 months is a structural problem, likely a weak listing, poor reviews, or wrong category targeting.
An ASIN with a 32% TACoS after 60 days is doing exactly what it should. The same number means completely different things depending on context, and flattening them into one account-level ACoS metric hides both problems and opportunities.
The second implication: when you layer in external traffic that generates organic purchase signals, TACoS compresses faster than paid spend alone can achieve. External purchases that come in through creator content or influencer channels don’t register in your ad spend denominator, but they do increase your total revenue numerator.
Every $5,000 in influencer-driven sales you add to the denominator drops your TACoS by a measurable amount without touching a single bid.
This is why Stack Influence belongs in the same stack. Their AI matches micro-influencer campaigns from a network of 11M+ micro-influencers, and you simply pay them only with your products.
Trusted by brands like Martha Stewart and Unilever to reach 5X average platform ROAS, generate the kind of organic velocity that compresses TACoS from the revenue side rather than the spend side. You can sign up this week and save 10% on your first campaign.
Together with HubSpot
Stay connected to the context that matters.

You have more tools than ever. So why does it feel like critical context is still missing?
HubSpot’s 2026 Essential Apps for Marketers collection brings together 14 apps across creative, ads, events, and more, so the context you need travels with every campaign, decision, and handoff.
🔍 AI Overviews are changing how people use Google
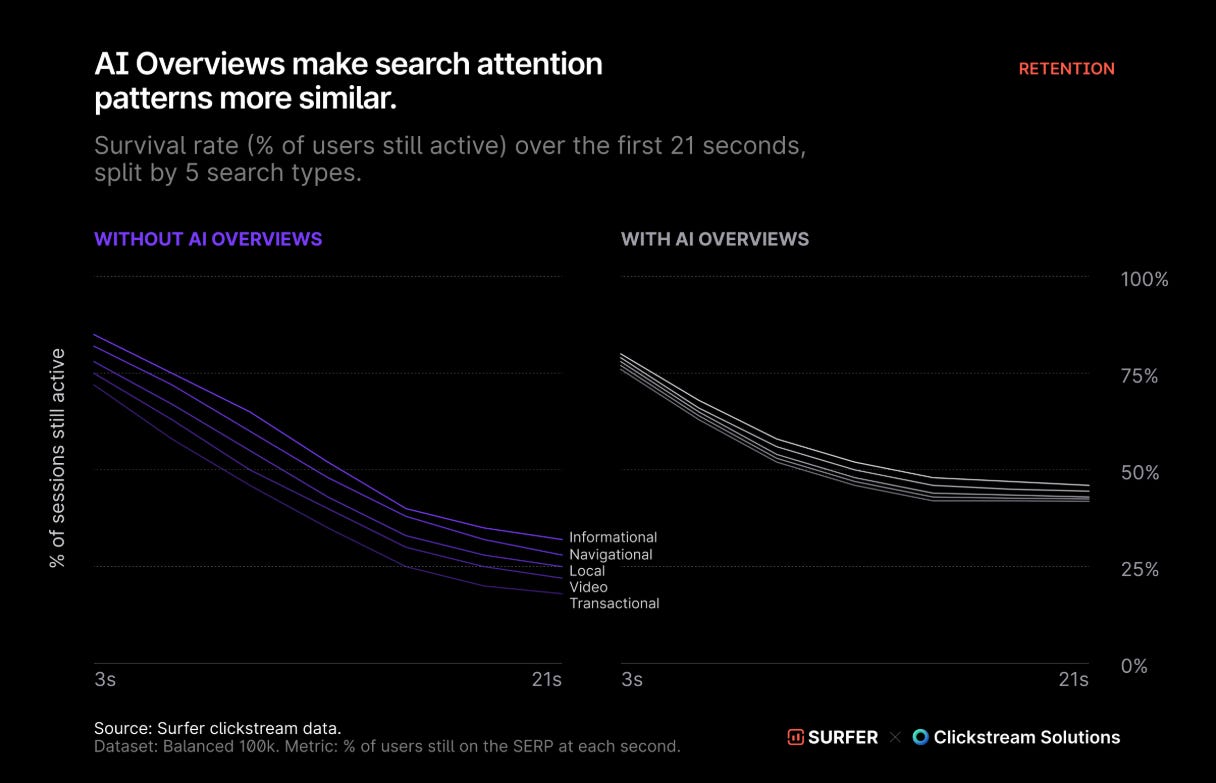
A new study analyzing 846,000 Google searches found AI Overviews are fundamentally changing user behavior, keeping people on search pages longer and pushing users into slower, more comparison-focused decision-making patterns.
The Breakdown:
AI Overviews slow decisions - Researchers found users spent significantly more time on Google when AI Overviews appeared, regardless of search intent, with engagement patterns becoming far more consistent across all query types.
Navigational behavior shifted heavily - Users searching directly for brands or websites no longer clicked immediately, with AI Overviews pulling even highly intentional users into broader page exploration before visiting destinations.
Users started reading differently - Cursor tracking showed users paused more often while covering larger areas of the page, suggesting people increasingly read, evaluate, and compare listings instead of quickly selecting top results.
Users revisited listings repeatedly - Researchers found users scrolled back upward far more frequently on AI Overview pages, signaling active reconsideration and comparison behavior instead of one-direction scanning toward immediate clicks.
Google search is increasingly becoming a decision environment instead of just a traffic gateway. Brands now need search listings built for scrutiny and comparison, not simply visibility or ranking position alone.
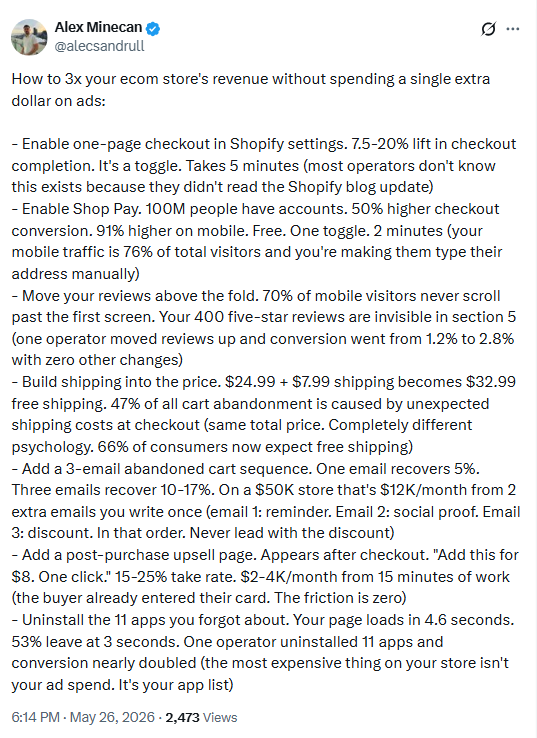
🗝️ Tweet of the Day
Advertise with Us
Wanna put out your message in front of over 50,000 best marketers and decision makers?
Checkout our Partner Kit here🤝
At Buyology, we care about our readers and want to provide the best possible experience. That's why we always look for ways to improve our content and connect with our audience. It would be amazing if you could hit us up with feedback about our content or absolutely anything, we are always up for a chat 🥰
Thanks for your support, We'll be back with more such content 🥳